Philly Challenge
Problem
Philadelphia has a strong employment base in higher education and healthcare‐related industries. However, other sectors such as manufacturing continue to lose jobs. The task for government is to support workforce development and business assistance in industry sectors where Philadelphia has a competitive advantage.
Specific considerations that impact local development include:
- Philadelphia’s concentration of talent in specific industries
- “Hot” industries that are primed for growth
- City policies, demographics, and geography
Visualize opportunities for economic development in the City of Philadelphia. The city wants to be able to focus its business attraction and retention and workforce development efforts in industries that will remain competitive in the future.
There are several things which have been useful in identifying economic opportunities:
- Sectors in which Philadelphia has a competitive advantage relative to the region, state, or nation
- Emerging sectors that are growing at a faster rate locally than in the region, state, or nation
- Subsectors that are driving growth over time within a particular sector
Data
The Bureau of Labor Statistics provides data about employment and businesses at the County level using NAICS (North American Industry Classification System) codes. You can learn more about NAICS, and get their definitions at the US Census Site.
- Find 2012 data on the Bureau of Labor Statistics FTP server. For comparison data, find other years here.
- Specifically, select 2012.annual.by_area.zip and use it as the Final Year. Select your own Base Year.
- Search for Philadelphia County, Pennsylvania
Useful comparisons:
- U.S. Total
- Philadelphia-Camden-Wilmington, PA-NJ-DE-MD MSA
- Pennsylvania — Statewide
- U.S. Metropolitan Statistical Areas (Combined)
Example
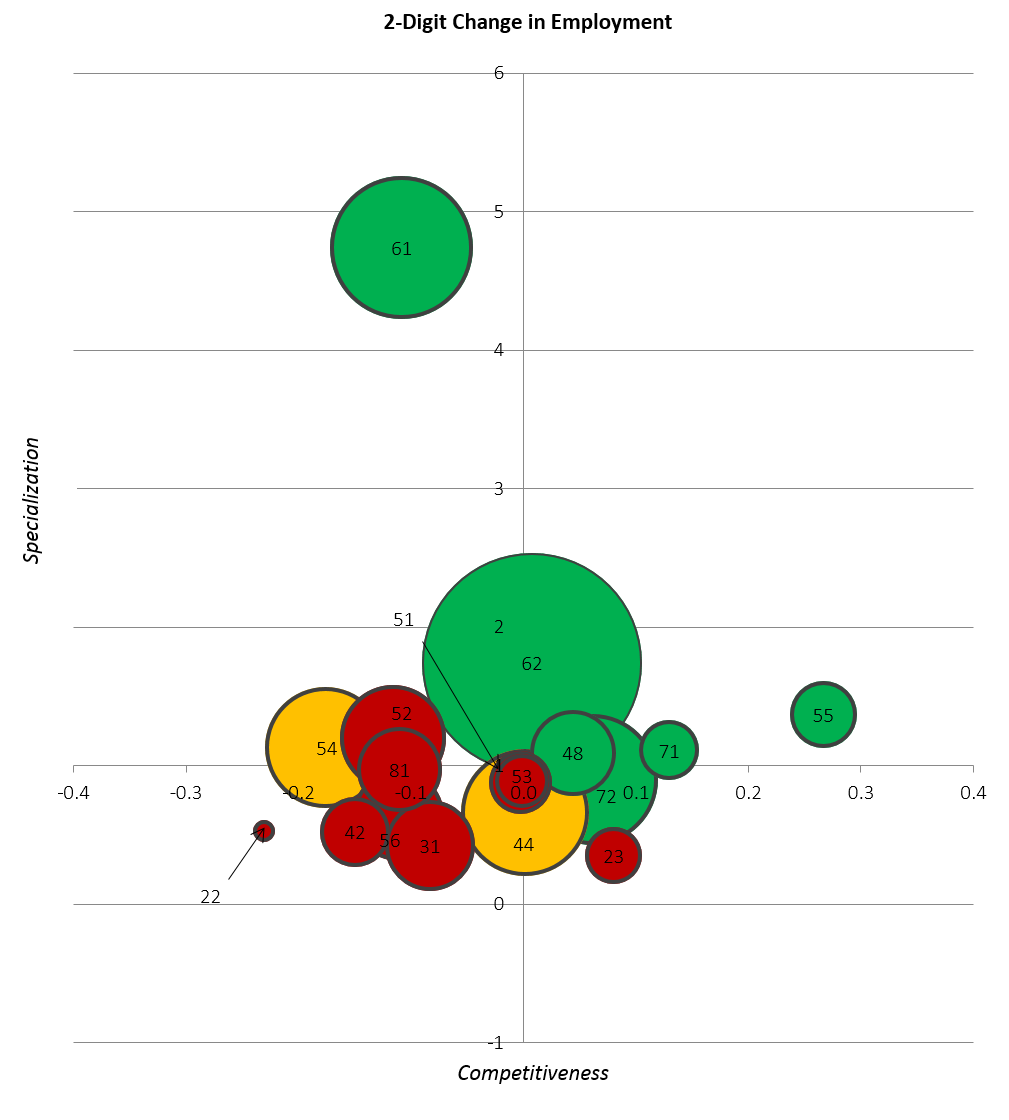
Bubble-Chart to Display Four Distinct Variables that Can Compare Philadelphia with the Country, the State, and the Region
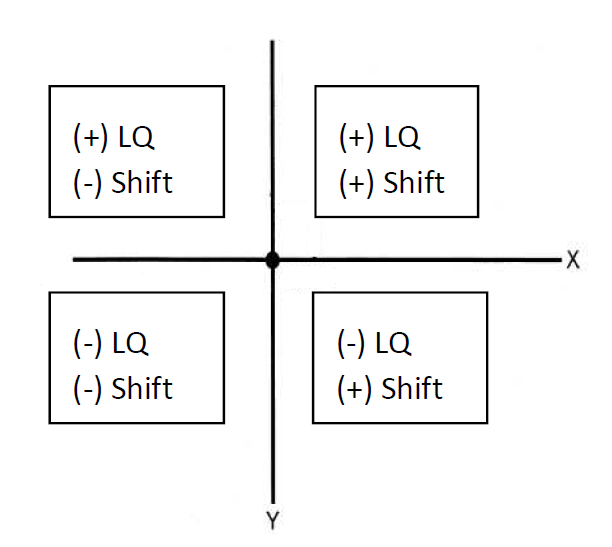
A “location quotient” measures how specialized a local economy is in a particular sector. It is calculated by dividing the share of employment in a particular sector in the local economy by the share in that sector in the national economy. The local economy is specialized in that sector if that number is greater than one. It is the y-axis of the depicted graph.
A “shift-term” measures the competitiveness of that sector, or the local rate of change relative to the national rate of change. It is the x-axis of the depicted graph. Thus, a sector with a positive “Shift Term”, which would lie on the rightward quadrants of the graph, would be growing at a faster rate, or shrinking at a slower rate, than that sector nationally. The formula for calculating the shift-term can be found below:
(eit+n/eit) – (Eit+n/Eit) where:
- ei = total employment of a particular sector in the local economy
- Ei = total employment of a particular sector in the national economy
- t = year one
- t+n = final year
The size of the bubble represents size of local employment in a particular sector in the final year.
The color tells us if the sector is growing or shrinking (in raw numbers and not relative to the national economy). Green would represent sectors that have grown by more than 5%, yellow for stable sectors that have had employment changes between -5% and 5%, and red for sectors that have declined by more than 5%.
An analysis of private business sectors on the 2-digit level using this approach, a time-series of 2004-2011, and comparing Philadelphia with the nation.
Click image to see full size