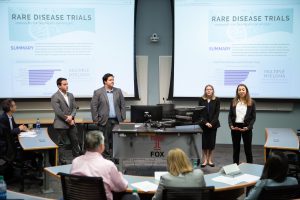
The Seventh Annual Temple University Alexion Analytics Challenge, organized by the Institute for Business and Information Technology, is a forum for talented students across colleges to showcase their analytic skills. This year’s Challenge, held in October, featured 300 competing students, all of whom presented analyses aiming to answer a single question: “What makes rare disease clinical trials successful?”

Sponsor Alexion Pharmaceuticals provided the data for the 114 participating teams to analyze over the course of the month; each team presented both analysis and an original visualization, which were judged by a panel of industry professionals. Twelve teams representing three colleges went on to the final round, where they presented their analyses to the judges, who announced the seven winning teams in November.
The winners were:
1st Place Analysis: Jake Green, Lauren Remy, Rohit Bobby
2nd Place Analysis: Sofia Spadotto and Madison Collins
3rd Place Analysis: Vittoria Fani Ciotti, Amanda Olsen, Kyle Miller, Michael Manieri
Honorable Mention Analysis: Aleksey Kravets
1st Place Graphics: Diana Westerfer and Serdar Kurt
2nd Place Graphics: Thomas Swanson, Chirag Bhatia, Christian Siegfried
3rd Place Graphics: Qiwen Tan
Honorable Mention Graphics: Javier Balleste and Brock Brones
 “What intrigues me is seeing the evolution of problem-solving capabilities,” says data scientist Hope Watson, challenge engineer and judge representing Alexion at the event. Watson, a Temple alum, is also a former Challenge winner herself: In 2016, her team won first place on the Analysis track. (In fact, upon winning, Watson was hired on the spot by that year’s sponsoring company, Alexion.) “This year I had the privilege of creating and judging this event. I was impressed with the students’ submissions!”
Winners of the Graphics category, Westerfer and Kurt, incorporated hand-drawn images for graphics that felt like a personalized form of story-telling. “With data analytics you have to hit this perfect balance between getting all the important information out, and then actually getting people to listen to you,” Westerfer said. “One of the easiest ways to get people to connect with the story you’re trying to tell is through an engaging visual– it helps them connect the data to YOU and keeps the presentation personal and engaging.”
Meanwhile, the winning team for the Analysis track credited their win to a strategic research approach. Green said: “We realized early on that our analytical methodology would have to be directly tied to our definitions of scientific and monetary success. Only when we fully understood the question’s context did we move on to finding the answers in our data.”
Of course, creating a forum for students to use their data analysis and visualization skills to tackle this type of real-world business issue is exactly the aim of the Analytics Challenge. The competition also serves participants in other ways, offers Laurel Miller, Director.
“It’s an opportunity for students to learn, develop, and showcase their abilities to a room full of industry experts invested in the outcome of the presentation.”
“We are all happy with the result and will take the lessons learned with us throughout our future professional endeavors,” added Green.
Learn more about the Temple University Analytics Challenge.
See all of the winning entries here.


