• Skip to primary navigation
  • Skip to main content
IBIT

IBIT

Engages with industry to develop digital knowledge and talent

  • Home
  • Knowledge
    • AI Opportunity Index
    • National Information Systems Job Index
    • Digital Innovation Foundry
      • Digital Innovation Foundry Workshops
    • Quantifying Impact
    • Case studies
    • Projects and Research
    • The IBIT Report
  • Talent
    • Mentoring Program
    • Scholarships
    • Professional Training
    • Prior Talent Development Activities
      • Temple Analytics Challenge
      • National Cyber Analyst Challenge
  • Engagement
    • Advisory Board
    • Executive-in-Residence
    • Symposiums and Conferences
    • Information Technology Awards
    • Prior Engagement Activities
      • Small Business and Non-Profit Digital Transformation
      • Digital Leader Fireside Chats
  • Partners
  • About
    • Mission
    • Annual Report
    • Impact Analysis
    • News
    • Staff
    • Advisory Board
    • Contact Us and Directions
  • Show Search
Hide Search

Analytics Challenge

Students showcase data visualization and analysis skills at the Alexion Analytics Challenge

The Seventh Annual Temple University Alexion Analytics Challenge, organized by the Institute for Business and Information Technology, is a forum for talented students across colleges to showcase their analytic skills. This year’s Challenge, held in October, featured 300 competing students, all of whom presented analyses aiming to answer a single question: “What makes rare disease clinical trials successful?”

Sponsor Alexion Pharmaceuticals provided the data for the 114 participating teams to analyze over the course of the month; each team presented both analysis and an original visualization, which were judged by a panel of industry professionals. Twelve teams representing three colleges went on to the final round, where they presented their analyses to the judges, who announced the seven winning teams in November.
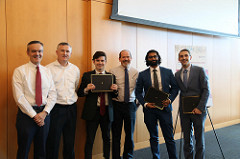
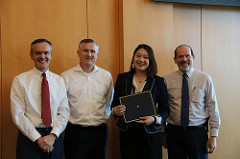
The winners were:

1st Place Analysis: Jake Green, Lauren Remy, Rohit Bobby

2nd Place Analysis: Sofia Spadotto and Madison Collins

3rd Place Analysis: Vittoria Fani Ciotti, Amanda Olsen, Kyle Miller, Michael Manieri

Honorable Mention Analysis: Aleksey Kravets

1st Place Graphics: Diana Westerfer and Serdar Kurt

2nd Place Graphics: Thomas Swanson, Chirag Bhatia, Christian Siegfried

3rd Place Graphics: Qiwen Tan

Honorable Mention Graphics: Javier Balleste and Brock Brones

“What intrigues me is seeing the evolution of problem-solving capabilities,” says data scientist Hope Watson, challenge engineer and judge representing Alexion at the event. Watson, a Temple alum, is also a former Challenge winner herself: In 2016, her team won first place on the Analysis track. (In fact, upon winning, Watson was hired on the spot by that year’s sponsoring company, Alexion.) “This year I had the privilege of creating and judging this event. I was impressed with the students’ submissions!”

Winners of the Graphics category, Westerfer and Kurt, incorporated hand-drawn images for graphics that felt like a personalized form of story-telling. “With data analytics you have to hit this perfect balance between getting all the important information out, and then actually getting people to listen to you,” Westerfer said. “One of the easiest ways to get people to connect with the story you’re trying to tell is through an engaging visual– it helps them connect the data to YOU and keeps the presentation personal and engaging.”

Meanwhile, the winning team for the Analysis track credited their win to a strategic research approach. Green said: “We realized early on that our analytical methodology would have to be directly tied to our definitions of scientific and monetary success. Only when we fully understood the question’s context did we move on to finding the answers in our data.”

Of course, creating a forum for students to use their data analysis and visualization skills to tackle this type of real-world business issue is exactly the aim of the Analytics Challenge. The competition also serves participants in other ways, offers Laurel Miller, Director.

“It’s an opportunity for students to learn, develop, and showcase their abilities to a room full of industry experts invested in the outcome of the presentation.”

“We are all happy with the result and will take the lessons learned with us throughout our future professional endeavors,” added Green.

Learn more about the Temple University Analytics Challenge.

See all of the winning entries here. 

View the photos

Winners Announced For 6th Annual Temple University NBCUniversal Analytics Challenge

The 6th Annual NBCUniversal Temple University Analytics Challenge attracted more than 135 entries across six colleges, with the first-place finishers coming from Fox School of Business, Klein College of Media and Communications and the Tyler School of Art.

2018 Analytics Challenge Winners

MIS students Jake Green and Rohit Bobby partnered with Klein’s Sergio Aguilar to win the analysis category. Tyler School of Art student Xi (Cynthia) Cheng was the graphics category winner. The first-place finishers took home $2,500. There were also cash prizes for the second and third place winners and two honorable mentions in each category.

“All of the teams put a lot of work into their challenges,” said MIS Assistant Professor Laurel Miller, who organized the event and serves as Director of the Institute for Business and Information Technology. Miller was also a mentor to the three-member analysis team winners and said she was impressed “by how meticulously they looked at each and every angle.”

Teams could choose from three data sets to answer the following questions: The first, from competition sponsor NBCUniversal, asked how media companies align with esports; the second, from global biopharmaceutical company Alexion, sought to learn who the winners and losers were in healthcare funding and payments; the third, from pharmaceutical distributor AmerisourceBergen, questioned why pharmacies buy drugs from non-primary vendors.

This was the first year a sports-related challenge was offered and many teams were drawn to that. Both first place winners took on the NBCUniversal challenge. Graphics winner Cheng used images from Pac-Man and simple synthesizer sounds to look at the overlap between esports viewers and traditional sports fans in her four-minute video. The analysis trio reworked the question, team member Green said, to ask, “What can media companies and specifically, networks such as those powered by NBC sports group do to adapt to the esports audience and remain a leading delivery and engagement platform for sport entertainment?”

2018 Xi Cheng Winner

“This project taught me so many lessons that will be of value in my future professional endeavors,” Green said. “It taught us to give more with less. It taught us to condense mountains of data and weeks’ worth of information gathering into a four-minute pitch. We had the privilege of coming together as a team in pursuit of a common goal, despite our differences in educational background.”

Aidan Doyle, Alexion’s Director of Data and Analytic Platforms and a first-time competition judge, said he was impressed by the students and the challenges they tackled.

“When I went to college, you signed up for a class, walked into an amphitheater, the professor wrote on a board, you wrote it down and at the end you’d take a test,” said Doyle. “What I see in the system in the US 30 years later, especially at Temple, is a collaborative effort that brings the best ideas together between all faculty while engaging students and industry… To me, it summed up why Temple and other institutions are the place to be.”

Learn more about the Temple University Analytics Challenge.

See all of the winning entries here. 

Winners Announced For 5th Annual Temple University QVC Analytics Challenge

Does speed matter in e-commerce? How can you eliminate the harmful effects of smoking on society? How can you predict which movies will be a hit or a bust? These were the questions posed this year by the annual Temple University QVC Analytics Challenge and its sponsors QVC, Pfizer, and NBCUniversal.

Now in its fifth year, 582 students from 10 different schools and colleges across the university participated in the competition, organized by the Institute for Business and Information Technology (IBIT), where participants solve important industry-specific problems using data. This year’s 245 entries were judged in two categories—analytics and graphics—and winners took home $12,000 in cash prizes from the event, held Nov. 13, 2017 at Alter Hall, home of the Fox School of Business.


The winner of the graphics category was a team consisting of Charles Attisano and Luke Harding, two seniors studying graphic and interactive design at the Tyler School of Art. They worked on the NBCUniversal challenge about movie box office forecasting and produced a short video exploring the topic, which you can watch here.

“We concluded that, on average, the highest performing movies in the box office tend to be adventure films with production budgets between $100-250 million, and release dates in May, June, or December,” said Attisano and Harding. “Providing a formula for success, on average, may help a producer choose a genre, budget, and release date. One of the most important things we learned in the process is that storytelling is an integral part of the analyzing process, and that you must communicate your analysis in a clear manner.”


The winner in the analytics category was a team of four Fox School students majoring in management information systems: Ngoc Pham, Chi Pham, Run Zhu, and Jiawei Huang. They focused on QVC’s e-commerce problem, and showed how the shopping network can ship the right products at the right time to its customers. (See the winning infographic here.)

“Working with raw data is like playing a video game,” the team explained. “You have the same goal to fulfill certain tasks, and there are tons of approaches that can be used to accomplish this goal. We provided our recommendations for highly underutilized distribution centers in terms of product categories based on their sales. By implementing our recommendations, QVC could increase its sales volume in California, Texas, and Florida within three months.”

One of the most thrilling aspects of the Analytics Challenge is that participants represent many different schools and colleges across the university. This means teams approach data, analysis, and visualization in diverse ways, and they bring unique, multi-disciplinary insights to each problem.

“It was exciting this year to see how well so many students from so many different majors instinctively understood the importance of the science of data,” said Laurel Miller, assistant professor of management information systems, IBIT director, and the co-founder of the Analytics Challenge. “It was hard to pick the winners, and all the students should feel proud of how well they did.”

Learn more about the Temple University Analytics Challenge.

See all of the winning entries here. 

Winners Announced for 4th Annual Temple Analytics Challenge

The Institute for Business and Information Technology is proud to announceGeorge Llado, keynote speaker, addresses the crowd. 
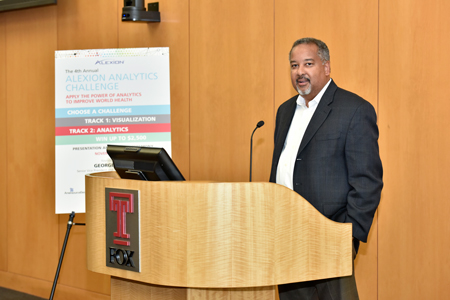
the winners of The 4th Annual Temple University Alexion Analytics Challenge. The competition, which was open to all Temple University students and featured problems and data sets from Alexion, AmerisourceBergen, and Merck, culminated on November 16th with final student presentations and an awards ceremony. Students won prizes of $500-$2,500 out of a total pool of $12,000. George Llado, Senior Vice President and Chief Information Officer, Alexion Pharmaceuticals, presented the keynote speech and assisted in presenting the awards.

Since its inception four years ago, the competition has attracted over 880 entries across the University. In 2016, there were 187 entries from 400 students from schools including Fox, CLA, Engineering, and Tyler.

The challenge is offered in cooperation with Office of Senior Vice Provost for Undergraduate Studies and the General Education program.

See all of the winners and their projects here.

Learn more about the Analytics Challenge at http://analyticschallenge.temple.edu


George Llado and David Schuff pose with the winners of the 4th Annual Temple Analytics Challenge. Judges for the 4th Annual Temple Analytics Challenge

Third annual Analytics Challenge triples in size with 719 students participating

For Cassandra Reffner, winning the Temple Analytics Challenge for a second straight year was about honing her visual storytelling skills one data set at a time. A senior graphic design student from the Tyler School of Art, Reffner took home the $2,500 grand prize at the third annual Temple Analytics Challenge, held Nov. 16 at the Fox School of Business.

Organized by the Institute for Business and Information Technology (IBIT), the competition awards prizes totaling $10,000, from corporate members of IBIT and the Office of the Senior Vice Provost for Undergraduate Studies at Temple University. The Temple Analytics Challenge focuses on making sense of big data through visualization — a key component of data analytics cited by experts as a promising path to job opportunities.

Participation increased by 300 percent over the previous year, with 395 entries. Participating teams included 719 students from eight of Temple’s 17 schools and colleges, as well as students from the State University of New York and Cornell University. The finalists came from programs in the Tyler School of Art, the College of Liberal Arts, the College of Engineering, the School of Media and Communications, the College of Public Health, and the Fox School of Business.

“The Temple Analytics Challenge emphasizes the Fox School’s commitment to teaching and research in the various fields connected to big data,” said Dr. M. Moshe Porat, Dean of the Fox School of Business and the School of Tourism and Hospitality Management. “But big data and data visualization are academic components in which students across Temple University regularly engage. This truly was a university-wide competition.”

Corporate partners provided competitors with large sets of data that they must analyze and visualize in a way that is both innovative and accessible. This year’s partners included Merck Pharmaceuticals, QVC, and The Pennsylvania Ballet.

Reffner, who won the Temple Analytics Challenge in 2014, chose to work with the data from The Pennsylvania Ballet, saying she could see the visuals presented within the data set. In the Pennsylvania Ballet challenge, students had to conceptualize the best way for the company to attract new audience members.

“With our limited resources, we just don’t have the time or the staff to do this kind of imagining,” said David Gray, executive director of The Pennsylvania Ballet. “Having so many smart and creative people trying to help us address challenges is a godsend.”

To expand on the project’s proposal, Reffner scrolled through various mentions the company received on social media — from Tweets and hashtags to status updates — to see what about the company got people talking. She said was intrigued by the company’s position as a “19th-century product for a 21st-century audience,” and drafted a plan that took this value and social media’s talk-back feature to improve customer interaction. She suggested a redesign of The Pennsylvania Ballet’s website to respond on all devices, including desktops, smartphones, and tablets, so customers could interact with the ballet by any means necessary.

Reffner and 19 other finalists went before a panel of judges comprised of industry leaders, including representatives from Lockheed Martin, Campbell’s Soup Company, Deloitte Consulting and AmerisourceBergen. The judges were impressed with the overall dedication the students brought to the challenge.

“This competition is not focused toward any specific major,” Reffner said. “It’s people from all over the place that entered the competition. That’s why I love the Temple Analytics Challenge.”

Beyond The Pennsylvania Ballet challenge, student participants had the choice of two others. The Merck challenge tasked students with synthesizing data to show how a vaccine will best benefit world health. QVC provided data relating to product placement in various markets and asked students to show how this data could predict where it should next focus its attention.

“Data alone is just information. It’s usage to inspire change or action and turning it into competitive intelligence is where the value lies, and the Temple Analytics Challenge did just that,” said Maurice Whetstone, QVC’s Director of Enterprise Data Management.

Jordan Bonner, Actuarial Science student at the Fox School of Business won second place along with Samantha Rogers, Psychology student in the College of Liberal Arts. The winners are featured in the 2015 Temple Analytics Challenge Gallery.

“Analytics in business, and especially in healthcare, is an amazing lever toward gaining unique insight to improve business performance,” said Bill Stolte, the Executive Director of Merck’s IT Business Performance Analytics. “It is an honor to be actively engaged in the Temple Analytics Challenge, and it is remarkable to watch Temple University students rapidly self-organize and use data and visualizations in innovative ways to solve complex problems.”

Professors James Moustafellos, David Schuff, and Laurel Miller in the Management Information Systems department of the Fox School of Business organized the Challenge for IBIT.

  • Go to page 1
  • Go to page 2
  • Go to Next Page »
FOX_Formal_Red_White-300x125

Institute for Business and Information Technology

207 Speakman Hall
1810 N. 13th Street
Philadelphia, PA 19122

About
Staff
Advisory Board
Partners
News
Contact us and directions
LinkedinFlickr

Copyright © 2025 IBIT · Fox School of Business · Temple University · contact us at ibit@temple.edu